Denver neighborhood crime rate rankings, 2020
The lower the ranking number, the worse the crime rate in that neighborhood. So if, say, Lincoln Park was ranked #1 in business burglaries, that means Lincoln Park has the highest population-adjusted rate of business burglaries out of Denver's 78 neighborhoods.
Note that neighborhoods with fewer residents but higher foot traffic, such as CBD, DIA, Civic Center and Auraria, may be disproportionately represented in the rankings.
Click or tap a table column to sort by that column.
Table: Compare 2020 Denver neighborhood property crime rate rankings
| Neighborhood | Property crime | Residential burglary | Business burglary | Burglary, by force |
Burglary, unforced | Auto theft | Arson |
|---|---|---|---|---|---|---|---|
| Athmar Park | 52 | 68 | 39 | 41 | 74 | 37 | 16 |
| Auraria | 12 | 18 | 8 | 9 | 14 | 27 | 61 |
| Baker | 8 | 40 | 6 | 12 | 10 | 6 | 15 |
| Barnum | 64 | 32 | 62 | 31 | 62 | 63 | 11 |
| Barnum West | 77 | 71 | 77 | 76 | 75 | 70 | 75 |
| Bear Valley | 68 | 70 | 56 | 63 | 67 | 47 | 37 |
| Belcaro | 44 | 41 | 38 | 42 | 40 | 60 | 74 |
| Berkeley | 43 | 11 | 42 | 45 | 9 | 56 | 70 |
| Capitol Hill | 19 | 17 | 23 | 22 | 26 | 26 | 17 |
| CBD | 3 | 20 | 3 | 4 | 6 | 4 | 4 |
| Chaffee Park | 38 | 44 | 72 | 65 | 47 | 25 | 26 |
| Cheesman Park | 28 | 10 | 50 | 24 | 22 | 53 | 30 |
| Cherry Creek | 17 | 24 | 16 | 18 | 19 | 46 | 44 |
| City Park | 25 | 38 | 36 | 35 | 44 | 42 | 10 |
| City Park West | 15 | 8 | 17 | 14 | 13 | 21 | 32 |
| Civic Center | 4 | 2 | 4 | 1 | 2 | 10 | 2 |
| Clayton | 47 | 52 | 57 | 57 | 51 | 50 | 27 |
| Cole | 49 | 30 | 33 | 27 | 38 | 48 | 6 |
| College View / South Platte | 36 | 39 | 22 | 21 | 55 | 32 | 13 |
| Congress Park | 56 | 27 | 66 | 50 | 33 | 61 | 18 |
| Cory-Merrill | 39 | 58 | 45 | 64 | 41 | 75 | 78 |
| Country Club | 53 | 16 | 53 | 56 | 17 | 73 | 54 |
| DIA | 1 | 4 | 7 | 6 | 5 | 1 | 3 |
| East Colfax | 34 | 21 | 59 | 32 | 34 | 15 | 48 |
| Elyria-Swansea | 24 | 48 | 9 | 15 | 24 | 12 | 8 |
| Five Points | 6 | 9 | 13 | 13 | 8 | 13 | 12 |
| Fort Logan | 78 | 78 | 60 | 74 | 77 | 77 | 59 |
| Gateway / Green Valley Ranch | 70 | 72 | 71 | 71 | 70 | 49 | 52 |
| Globeville | 14 | 37 | 12 | 16 | 28 | 3 | 14 |
| Goldsmith | 26 | 46 | 26 | 29 | 48 | 8 | 39 |
| Hale | 33 | 23 | 44 | 39 | 29 | 45 | 68 |
| Hampden | 46 | 49 | 46 | 51 | 49 | 20 | 53 |
| Hampden South | 48 | 65 | 30 | 48 | 58 | 35 | 51 |
| Harvey Park | 72 | 73 | 51 | 59 | 73 | 72 | 55 |
| Harvey Park South | 61 | 69 | 32 | 49 | 61 | 55 | 29 |
| Highland | 16 | 5 | 19 | 10 | 7 | 29 | 58 |
| Hilltop | 65 | 57 | 65 | 60 | 63 | 71 | 35 |
| Indian Creek | 74 | 75 | 74 | 78 | 68 | 66 | 76 |
| Jefferson Park | 10 | 3 | 34 | 19 | 4 | 16 | 22 |
| Kennedy | 37 | 29 | 63 | 33 | 52 | 9 | 38 |
| Lincoln Park | 9 | 51 | 14 | 17 | 50 | 7 | 24 |
| Lowry Field | 45 | 28 | 52 | 58 | 21 | 41 | 47 |
| Mar Lee | 73 | 67 | 61 | 61 | 71 | 64 | 36 |
| Marston | 71 | 77 | 68 | 75 | 78 | 76 | 40 |
| Montbello | 75 | 76 | 67 | 69 | 79 | 59 | 45 |
| Montclair | 30 | 59 | 25 | 47 | 46 | 40 | 42 |
| North Capitol Hill | 11 | 6 | 15 | 8 | 15 | 22 | 9 |
| North Park Hill | 76 | 47 | 79 | 70 | 53 | 78 | 49 |
| Northeast Park Hill | 21 | 45 | 18 | 23 | 39 | 11 | 34 |
| Overland | 7 | 43 | 1 | 2 | 12 | 5 | 5 |
| Platt Park | 23 | 14 | 20 | 20 | 18 | 39 | 23 |
| Regis | 40 | 50 | 29 | 43 | 45 | 34 | 77 |
| Rosedale | 35 | 13 | 48 | 25 | 30 | 28 | 20 |
| Ruby Hill | 67 | 61 | 43 | 46 | 72 | 51 | 65 |
| Skyland | 58 | 12 | 64 | 30 | 25 | 68 | 60 |
| Sloan Lake | 50 | 25 | 41 | 36 | 27 | 67 | 71 |
| South Park Hill | 62 | 63 | 54 | 66 | 54 | 65 | 31 |
| Southmoor Park | 27 | 55 | 47 | 52 | 59 | 17 | 63 |
| Speer | 22 | 35 | 40 | 37 | 43 | 30 | 41 |
| Central Park | 13 | 19 | 24 | 44 | 11 | 14 | 28 |
| Sun Valley | 18 | 53 | 5 | 7 | 31 | 24 | 69 |
| Sunnyside | 54 | 31 | 55 | 55 | 32 | 38 | 64 |
| Union Station | 5 | 7 | 2 | 3 | 3 | 23 | 21 |
| University | 66 | 66 | 76 | 77 | 66 | 74 | 66 |
| University Hills | 41 | 42 | 21 | 28 | 42 | 54 | 62 |
| University Park | 42 | 54 | 37 | 62 | 36 | 44 | 56 |
| Valverde | 29 | 74 | 10 | 11 | 69 | 18 | 7 |
| Villa Park | 57 | 33 | 31 | 26 | 56 | 52 | 33 |
| Virginia Village | 51 | 64 | 27 | 38 | 60 | 36 | 46 |
| Washington Park | 60 | 36 | 75 | 72 | 35 | 69 | 67 |
| Washington Park West | 31 | 22 | 58 | 54 | 20 | 43 | 72 |
| Washington Virginia Vale | 55 | 60 | 35 | 40 | 65 | 33 | 50 |
| Wellshire | 79 | 79 | 73 | 79 | 76 | 79 | 79 |
| West Colfax | 20 | 26 | 28 | 34 | 23 | 19 | 25 |
| West Highland | 32 | 15 | 70 | 67 | 16 | 58 | 57 |
| Westwood | 69 | 62 | 49 | 53 | 64 | 62 | 19 |
| Whittier | 59 | 34 | 78 | 73 | 37 | 57 | 43 |
| Windsor | 63 | 56 | 69 | 68 | 57 | 31 | 73 |
Table: Compare 2020 Denver neighborhood violent crime rate rankings
| Neighborhood | Violent crime |
Domestic violence |
Sexual assault |
Robbery | Aggravated assault |
|---|---|---|---|---|---|
| Athmar Park | 29 | 30 | 66 | 30 | 28 |
| Auraria | 15 | 7 | 27 | 9 | 18 |
| Baker | 20 | 51 | 22 | 7 | 24 |
| Barnum | 28 | 34 | 47 | 29 | 26 |
| Barnum West | 43 | 52 | 61 | 65 | 35 |
| Bear Valley | 68 | 48 | 55 | 62 | 69 |
| Belcaro | 65 | 66 | 78 | 45 | 62 |
| Berkeley | 60 | 55 | 68 | 50 | 58 |
| Capitol Hill | 19 | 22 | 26 | 23 | 16 |
| CBD | 3 | 8 | 4 | 2 | 3 |
| Chaffee Park | 30 | 33 | 62 | 8 | 53 |
| Cheesman Park | 38 | 38 | 24 | 39 | 37 |
| Cherry Creek | 54 | 73 | 42 | 35 | 66 |
| City Park | 46 | 53 | 35 | 31 | 52 |
| City Park West | 12 | 6 | 16 | 28 | 11 |
| Civic Center | 2 | 12 | 2 | 1 | 2 |
| Clayton | 17 | 21 | 63 | 11 | 17 |
| Cole | 26 | 37 | 57 | 22 | 25 |
| College View / South Platte | 25 | 17 | 51 | 24 | 23 |
| Congress Park | 53 | 60 | 59 | 51 | 54 |
| Cory-Merrill | 69 | 75 | 79 | 36 | 75 |
| Country Club | 78 | 79 | 71 | 76 | 77 |
| DIA | 4 | 1 | 3 | 6 | 4 |
| East Colfax | 11 | 23 | 20 | 12 | 13 |
| Elyria-Swansea | 13 | 24 | 10 | 21 | 12 |
| Five Points | 8 | 14 | 7 | 18 | 7 |
| Fort Logan | 63 | 58 | 41 | 71 | 57 |
| Gateway / Green Valley Ranch | 44 | 35 | 30 | 61 | 42 |
| Globeville | 10 | 4 | 13 | 20 | 9 |
| Goldsmith | 22 | 10 | 17 | 16 | 21 |
| Hale | 55 | 57 | 31 | 63 | 56 |
| Hampden | 35 | 28 | 32 | 37 | 34 |
| Hampden South | 56 | 45 | 64 | 59 | 55 |
| Harvey Park | 32 | 41 | 43 | 46 | 29 |
| Harvey Park South | 50 | 64 | 44 | 47 | 48 |
| Highland | 40 | 49 | 45 | 41 | 38 |
| Hilltop | 71 | 70 | 54 | 72 | 68 |
| Indian Creek | 73 | 56 | 39 | 79 | 72 |
| Jefferson Park | 37 | 42 | 29 | 33 | 39 |
| Kennedy | 23 | 11 | 56 | 27 | 22 |
| Lincoln Park | 7 | 5 | 6 | 15 | 8 |
| Lowry Field | 41 | 50 | 49 | 57 | 36 |
| Mar Lee | 39 | 40 | 33 | 48 | 41 |
| Marston | 61 | 65 | 38 | 53 | 67 |
| Montbello | 33 | 29 | 37 | 54 | 27 |
| Montclair | 45 | 62 | 74 | 26 | 51 |
| North Capitol Hill | 9 | 18 | 8 | 14 | 10 |
| North Park Hill | 51 | 71 | 48 | 58 | 47 |
| Northeast Park Hill | 16 | 13 | 11 | 34 | 14 |
| Overland | 21 | 25 | 25 | 19 | 20 |
| Platt Park | 72 | 74 | 67 | 64 | 70 |
| Regis | 42 | 44 | 21 | 49 | 44 |
| Rosedale | 62 | 39 | 12 | 78 | 71 |
| Ruby Hill | 34 | 31 | 36 | 55 | 31 |
| Skyland | 57 | 15 | 77 | 77 | 43 |
| Sloan Lake | 52 | 47 | 60 | 68 | 46 |
| South Park Hill | 59 | 61 | 70 | 43 | 60 |
| Southmoor Park | 66 | 69 | 40 | 70 | 63 |
| Speer | 58 | 59 | 52 | 44 | 59 |
| Central Park | 24 | 27 | 18 | 13 | 33 |
| Sun Valley | 5 | 3 | 5 | 3 | 6 |
| Sunnyside | 48 | 32 | 76 | 38 | 45 |
| Union Station | 6 | 16 | 9 | 5 | 5 |
| University | 75 | 77 | 65 | 67 | 74 |
| University Hills | 67 | 68 | 69 | 56 | 64 |
| University Park | 70 | 67 | 53 | 60 | 73 |
| Valverde | 14 | 19 | 14 | 10 | 15 |
| Villa Park | 27 | 20 | 46 | 25 | 30 |
| Virginia Village | 64 | 54 | 58 | 66 | 61 |
| Washington Park | 74 | 76 | 23 | 75 | 78 |
| Washington Park West | 76 | 63 | 75 | 74 | 65 |
| Washington Virginia Vale | 47 | 46 | 28 | 52 | 49 |
| Wellshire | 79 | 78 | 72 | 73 | 79 |
| West Colfax | 18 | 9 | 19 | 17 | 19 |
| West Highland | 77 | 72 | 73 | 69 | 76 |
| Westwood | 31 | 26 | 50 | 32 | 32 |
| Whittier | 36 | 43 | 15 | 40 | 40 |
| Windsor | 49 | 36 | 34 | 42 | 50 |
Featured: Denver's 2024 crime map.
Denver crime maps
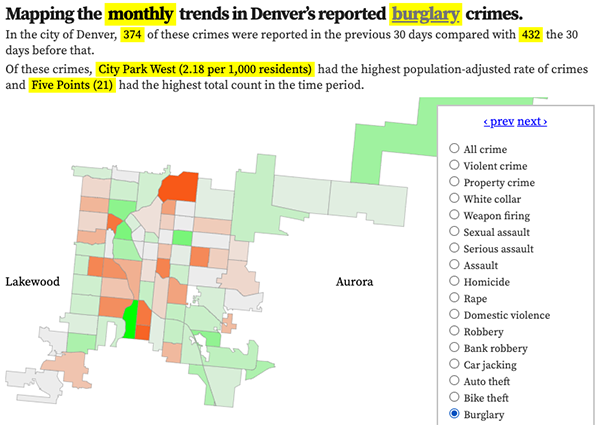
Denver crime trends map
The crimes trends map shows the change in crime counts and rates on a monthly and year-to-date basis.

The Denver-city recent crime map
The recent crimes map shows where crimes across the city were reported in the last two or so months, and shows which addresses across the city have logged the most reported crimes.

All city crime maps
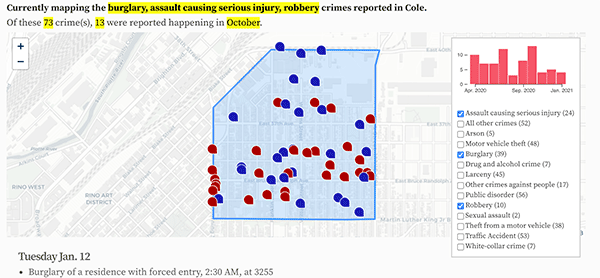
Choose from neighborhood and crime-specific crime maps.
