Denver Crimes is a publication that gives context to reported crime data in Denver.
We publish neighborhood crime reports that look at notable neighborhood crimes, as well as the monthly rate of crimes. We pay attention to the rate of crime per 1,000 residents, which gives a more accurate look at how your neighborhood compares with other Denver neighborhoods. We compare neighborhood crime rates for the year with the previous year's rates, which lets you know if that crime is getting better or worse.
Crime data comes with caveats. Here are the caveats on this data:
-
Not all crime is reported. This data is of the crimes reported by the Denver Police Department.
-
Not all reported crime is available. Crimes involving juveniles, or crimes where a juvenile was a witness are not included.
-
Crime rates will appear to be higher in neighborhoods with lots of foot traffic. Often these are neighborhoods with a significant commercial presence, such as CBD, Auraria, Union Station and Capitol Hill.
The data comes from the Denver Police Department's spreadsheet of crime incidents. Note that when the DPD doesn't update that spreadsheet, this site will not update either. Read more about Denver Police crime data here.
Updated: Colorado state crime rate charts.
Denver crime maps
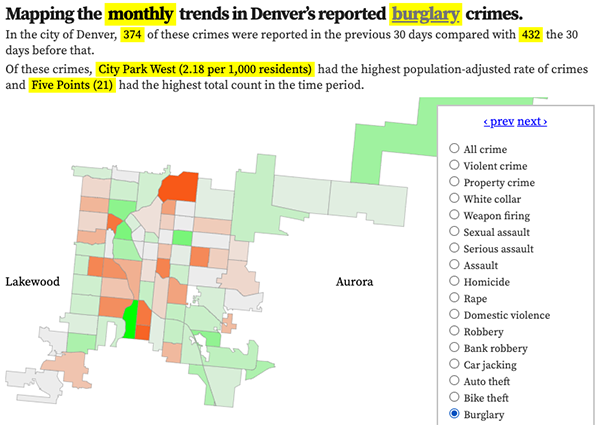
Denver crime trends map
The crimes trends map shows the change in crime counts and rates on a monthly and year-to-date basis.

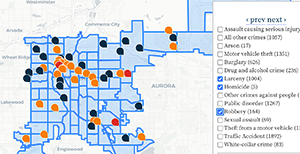
The Denver-city recent crime map
The recent crimes map shows where crimes across the city were reported in the last two or so months, and shows which addresses across the city have logged the most reported crimes.

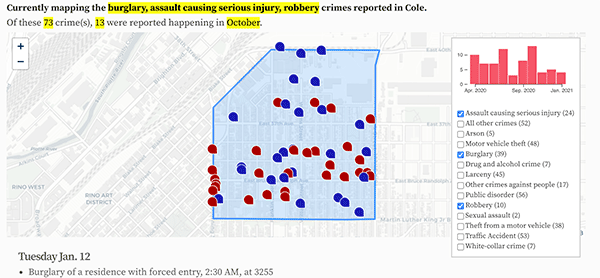
All city crime maps
Choose from neighborhood and crime-specific crime maps.
