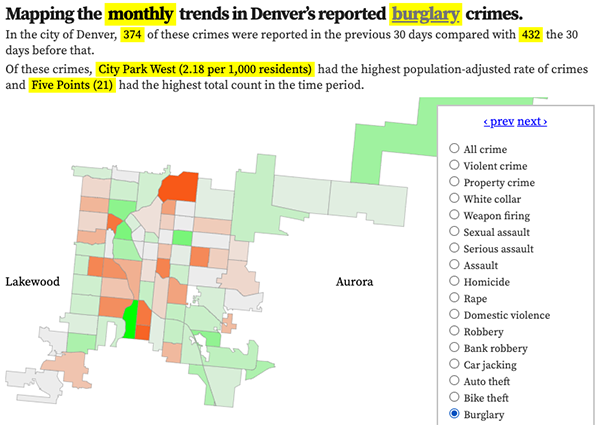
Denver neighborhood map, property crimes per 1,000 residents, 2025
Reported property crimes per 1,000 residents. Hover over or tap a neighborhood for details.
Denver property crime statistics
Monthly reported property crimes in Denver
In the last 48 months, the average number of crimes in a month was 3063.6 and the median was 3171.5. The most in any month was 3896, in May 2022, and the least was 928 in November 2025.
Property crime crimes, by time of day
What time reported property crimes happen in Denver.
Property crime crimes, by weekday
The day of the week reported property crimes happen.
New: Sign up for weekly or monthly email updates (when there's new crime data).
Denver property crimes in the news
- 1 of every 5 cars stolen in Colorado this year has been a Hyundai or Kia
- Published June 18
- Police recover hundreds of pounds of marijuana stolen from evidence trailer
- Published April 12
- Reported Colorado car thefts decrease 25% in 2024, according to new data
- Published April 9
- Year-end review: Denver neighborhood property crime in 2024, compared with 2023
- Published February 10
Recent crime ranking changes in property crime
There were 2 notable ranking changes in these crime categories when comparing the rankings four weeks ago to the current rankings. This list updates Mondays. The lower the rank the worse the reported crime.
- Berkeley improved 7 ranks, from 37th to 44th.
- Platt Park fell 6 ranks, from 43rd to 37th.
Featured: The best and worst neighborhoods for property crimes.
Property crime rate, Denver, 2025
- DIA: 854.59 per 1,000 residents (1052 incidents total)
- Auraria: 231.52 per 1,000 residents (191 incidents total)
- CBD: 143.0 (579)
- Civic Center: 137.37 (243)
- Union Station: 112.01 (567)
- Central Park: 106.66 (1880)
- Five Points: 104.08 (1537)
- Globeville: 92.65 (329)
- University Hills: 91.75 (543)
- Lincoln Park: 85.62 (517)
- Overland: 83.92 (272)
- North Capitol Hill: 81.72 (484)
- Sun Valley: 79.28 (114)
- Cherry Creek: 77.71 (487)
- Jefferson Park: 76.05 (215)
- Baker: 74.84 (434)
- City Park West: 71.13 (326)
- West Colfax: 62.17 (567)
- City Park: 60.72 (194)
- Cory-Merrill: 59.56 (281)
- Highland: 58.28 (524)
- Capitol Hill: 53.43 (839)
- Elyria-Swansea: 48.38 (323)
- Northeast Park Hill: 45.23 (411)
- Cheesman Park: 43.77 (374)
- Speer: 42.52 (500)
- Hale: 39.6 (268)
- Montclair: 38.76 (229)
- College View / South Platte: 38.04 (271)
- Cole: 35.87 (165)
- Lowry Field: 34.54 (283)
- East Colfax: 33.94 (382)
- West Highland: 33.81 (312)
- Congress Park: 33.27 (374)
- Sunnyside: 33.06 (325)
- Clayton: 32.94 (140)
- Valverde: 32.0 (120)
- Sloan Lake: 30.97 (242)
- Berkeley: 30.71 (263)
- Platt Park: 30.64 (176)
- Washington Park West: 28.89 (210)
- Chaffee Park: 28.68 (116)
- Rosedale: 28.47 (69)
- Goldsmith: 28.13 (148)
- University Park: 26.46 (200)
- Skyland: 25.74 (81)
- Athmar Park: 25.06 (217)
- Southmoor Park: 24.98 (121)
- University: 24.81 (233)
- Washington Virginia Vale: 24.74 (342)
- Villa Park: 23.97 (219)
- Hampden: 23.85 (450)
- Country Club: 23.85 (76)
- Hampden South: 22.91 (340)
- Virginia Village: 22.74 (321)
- Windsor: 22.3 (305)
- Belcaro: 22.21 (105)
- Kennedy: 22.13 (102)
- Whittier: 21.87 (131)
- Gateway / Green Valley Ranch: 19.94 (697)
- Westwood: 19.8 (328)
- Barnum: 19.72 (130)
- South Park Hill: 19.56 (179)
- Washington Park: 19.02 (139)
- Mar Lee: 19.02 (260)
- Harvey Park South: 18.31 (162)
- Bear Valley: 17.95 (166)
- Marston: 16.48 (186)
- Ruby Hill: 16.37 (177)
- Regis: 15.88 (67)
- Barnum West: 14.85 (87)
- Montbello: 14.64 (505)
- Harvey Park: 13.85 (176)
- North Park Hill: 13.67 (144)
- Fort Logan: 12.19 (107)
- Hilltop: 12.05 (111)
- Indian Creek: 9.97 (35)
- Wellshire: 7.73 (26)
Property crime count, Denver, 2025
- Central Park: 1880 incidents
- Five Points: 1537
- DIA: 1052
- Capitol Hill: 839
- Gateway / Green Valley Ranch: 697
- CBD: 579
- Union Station: 567
- West Colfax: 567
- University Hills: 543
- Highland: 524
- Lincoln Park: 517
- Montbello: 505
- Speer: 500
- Cherry Creek: 487
- North Capitol Hill: 484
- Hampden: 450
- Baker: 434
- Northeast Park Hill: 411
- East Colfax: 382
- Congress Park: 374
- Cheesman Park: 374
- Washington Virginia Vale: 342
- Hampden South: 340
- Globeville: 329
- Westwood: 328
- City Park West: 326
- Sunnyside: 325
- Elyria-Swansea: 323
- Virginia Village: 321
- West Highland: 312
- Windsor: 305
- Lowry Field: 283
- Cory-Merrill: 281
- Overland: 272
- College View / South Platte: 271
- Hale: 268
- Berkeley: 263
- Mar Lee: 260
- Civic Center: 243
- Sloan Lake: 242
- University: 233
- Montclair: 229
- Villa Park: 219
- Athmar Park: 217
- Jefferson Park: 215
- Washington Park West: 210
- University Park: 200
- City Park: 194
- Auraria: 191
- Marston: 186
- South Park Hill: 179
- Ruby Hill: 177
- Harvey Park: 176
- Platt Park: 176
- Bear Valley: 166
- Cole: 165
- Harvey Park South: 162
- Goldsmith: 148
- North Park Hill: 144
- Clayton: 140
- Washington Park: 139
- Whittier: 131
- Barnum: 130
- Southmoor Park: 121
- Valverde: 120
- Chaffee Park: 116
- Sun Valley: 114
- Hilltop: 111
- Fort Logan: 107
- Belcaro: 105
- Kennedy: 102
- Barnum West: 87
- Skyland: 81
- Country Club: 76
- Rosedale: 69
- Regis: 67
- Indian Creek: 35
- Wellshire: 26
- : 11
Recent Denver property crimes
November 14
- Motor vehicle theft, at 2:09 AM, at 4406 N Andes Ct in Gateway / Green Valley Ranch.
- Burglary of a residence without forced entry, at 12:00 AM, at the 2300 block of S Race St in University.
November 13
- Shoplifting, at 11:26 PM, at 1505 S Colorado Blvd in Cory-Merrill.
- Shoplifting, at 10:25 PM, at 8560 E Northfield Blvd in Central Park.
- Theft of items from a vehicle, at 10:10 PM, at the 3900 block of N Osceola St in Berkeley.
- Shoplifting, at 9:57 PM, at 3000 E 1St Ave in Cherry Creek.
- Shoplifting, at 8:03 PM, at 1600 California St in CBD.
- Theft of parts from a vehicle, at 7:30 PM, at the 3600 block of S Sheridan Blvd in Fort Logan.
- Burglary of a residence without forced entry, at 6:55 PM, at the 1000 block of N Decatur St in Sun Valley.
- Shoplifting, at 6:46 PM, at 560 N Corona St in Speer.
- Theft of parts from a vehicle, at 6:30 PM, at 9081 E Eastman Ave in Hampden.
- Burglary of a residence with forced entry, at 6:26 PM, at 1515 N Julian St in West Colfax.
- Theft from a building, at 4:42 PM, at 1600 California St in CBD.
- Theft from a building, at 3:00 PM, at 1530 W 13th Ave in Lincoln Park.
- Theft - other, at 2:49 PM, at the 7800 block of E 26th Ave in Central Park.
- Bicycle theft, at 2:45 PM, at the 1200 block of N Race St in Cheesman Park.
- Theft of items from a vehicle, at 2:30 PM, at 1460 W 38th Ave in Highland.
- Theft of items from a vehicle, at 2:30 PM, at 1210 N Clarkson St in Capitol Hill.
- Theft from a building, at 1:40 PM, at the 900 block of S Josephine St in Belcaro.
- Motor vehicle theft, at 1:35 PM, at 35 S Lowell Blvd in Barnum.
- Motor vehicle theft, at 1:30 PM, at the 4700 block of N Sherman St in Globeville.
- Theft from a mailbox, at 12:40 PM, at 2140 S Ash St in University Hills.
- Burglary of a business with forced entry, at 12:33 PM, at 700 W Mississippi Ave in Ruby Hill.
- Motor vehicle theft, at 12:00 PM, at 8501 E Alameda Ave in Lowry Field.
- Burglary of a residence without forced entry, at 11:43 AM, at the 1300 block of N Olive St in Montclair.
- Motor vehicle theft, at 11:13 AM, at the 16000 block of E Maxwell Pl in Gateway / Green Valley Ranch.
- Theft of items from a vehicle, at 10:59 AM, at 4522 N Fillmore St in Elyria-Swansea.
- Burglary of a business with forced entry, at 10:51 AM, at 1501 Boulder St in Highland.
- Theft - other, at 10:00 AM, at 2175 California St in Five Points.
- Theft of items from a vehicle, at 10:00 AM, at 1090 S Parker Rd in Windsor.
- Theft of parts from a vehicle, at 9:10 AM, at 1875 S Ogden St in Platt Park.
- Theft of items from a vehicle, at 9:00 AM, at 3853 N Shoshone St in Sunnyside.
- Motor vehicle theft, at 7:42 AM, at the 4900 block of S Ulster St in Hampden South.
- Theft of parts from a vehicle, at 7:30 AM, at 4322 N Columbine St in Elyria-Swansea.
- Motor vehicle theft, at 7:19 AM, at 4550 N Kittredge St in Gateway / Green Valley Ranch.
- Burglary of a business with forced entry, at 6:55 AM, at the 2700 block of Wewatta Way in Five Points.
- Theft of items from a vehicle, at 5:45 AM, at 1140 N Colorado Blvd in Hale.
- Bicycle theft, at 5:00 AM, at 425 S Cherokee St in Baker.
- Theft of items from a vehicle, at 5:00 AM, at 8501 E Alameda Ave in Lowry Field.
- Motor vehicle theft, at 5:00 AM, at 13870 E Albrook Dr in Montbello.
- Shoplifting, at 4:42 AM, at 93 N Quebec St in Lowry Field.
- Theft of items from a vehicle, at 4:30 AM, at N Logan St and E 13th Ave in Capitol Hill.
- Bicycle theft, at 4:00 AM, at the 1300 block of N Detroit St in Congress Park.
- Motor vehicle theft, at 4:00 AM, at 2836 N Xavier St in Sloan Lake.
- Motor vehicle theft, at 4:00 AM, at 18602 E 46th Pl in Gateway / Green Valley Ranch.
- Theft of items from a vehicle, at 4:00 AM, at 518 N Washington St in Speer.
- Motor vehicle theft, at 3:45 AM, at the 4400 block of N Stuart St in Berkeley.
- Motor vehicle theft, at 3:35 AM, at 5711 E Evans Ave in Virginia Village.
- Burglary of a business with forced entry, at 3:15 AM, at 3710 N Quebec St in Central Park.
- Theft of items from a vehicle, at 3:00 AM, at 1165 N Clarkson St in Capitol Hill.
More reported property crimes in Denver, or, property crimes by date.


