The Denver neighborhoods with the largest increase in violent crime, city pick-up truck stolen: Denver Post Crimes weekly
The Denver Crimes Thursday September 21, 2017 email newsletter.
It's a little late today. But it's worth it, I swear, I've been putting together a new piece of crime data, which you get to see before anyone else: This list of which Denver neighborhoods have seen their per-capita rate of violent crimes increase the most this year over last. Denver's violent crime rate is up this year, and these are the neighborhoods bearing the brunt of the increase. It's possible I'm more into this than you are. No matter, here it is:
Denver neighborhood violent crime rates, 2017 (so far) vs. 2016
Which neighborhoods have borne the brunt of Denver's increase in violent crime? This list ranks the Denver neighborhoods that have seen the largest increase in violent crime rate ranking so far this year. The higher the ranking, the higher the rate of crime.
- Washington Virginia Vale: +23 in ranking (33rd this year 56th last year)
- Hampden South: +17 (50th this year 67th last year)
- Sloan Lake: +17 (44th this year 61th last year)
- Montclair: +15 (29 this year 44 last year)
- Windsor: +13 (55 this year 68 last year)
- Belcaro: +12 (61 this year 73 last year)
- Chaffee Park: +12 (34 this year 46 last year)
- Goldsmith: +10 (23 this year 33 last year)
- Bear Valley: +9 (57 this year 66 last year)
- Baker: +8 (17 this year 25 last year)
- Highland: +8 (35 this year 43 last year)
- Jefferson Park: +8 (21 this year 29 last year)
- Valverde: +8 (11 this year 19 last year)
- Southmoor Park: +7 (67 this year 74 last year)
- Whittier: +7 (24 this year 31 last year)
- Congress Park: +6 (58 this year 64 last year)
- Berkeley: +5 (52 this year 57 last year)
- Globeville: +5 (12 this year 17 last year)
- Hale: +5 (37 this year 42 last year)
- Cheesman Park: +4 (30 this year 34 last year)
- Regis: +4 (49 this year 53 last year)
- Villa Park: +4 (26 this year 30 last year)
- Country Club: +3 (73 this year 76 last year)
- Sun Valley: +3 (1 this year 4 last year)
- Washington Park West: +3 (72 this year 75 last year)
- Auraria: +2 (5 this year 7 last year)
- Clayton: +2 (19 this year 21 last year)
- East Colfax: +2 (10 this year 12 last year)
- Hilltop: +2 (70 this year 72 last year)
- Lincoln Park: +2 (6 this year 8 last year)
- North Park Hill: +2 (60 this year 62 last year)
- Harvey Park: +1 (46 this year 47 last year)
- Stapleton: +1 (38 this year 39 last year)
- Barnum West: 0 (48 this year 48 last year)
- Civic Center: 0 (2 this year 2 last year)
- Hampden: 0 (51 this year 51 last year)
- Indian Creek: 0 (78 this year 78 last year)
- Marston: 0 (71 this year 71 last year)
- North Capitol Hill: 0 (9 this year 9 last year)
- Overland: 0 (18 this year 18 last year)
- University: 0 (65 this year 65 last year)
- Wellshire: 0 (77 this year 77 last year)
- Barnum: -1 (27 this year 26 last year)
- Capitol Hill: -1 (16 this year 15 last year)
- Cole: -1 (15 this year 14 last year)
- Union Station: -1 (4 this year 3 last year)
- CBD: -2 (3 this year 1 last year)
- DIA: -2 (8 this year 6 last year)
- Five Points: -2 (7 this year 5 last year)
- Speer: -2 (56 this year 54 last year)
- University Hills: -2 (40 this year 38 last year)
- City Park West: -3 (14 this year 11 last year)
- Harvey Park South: -3 (43 this year 40 last year)
- West Colfax: -3 (13 this year 10 last year)
- Gateway / Green Valley Ranch: -4 (59 this year 55 last year)
- Sunnyside: -4 (39 this year 35 last year)
- West Highland: -4 (64 this year 60 last year)
- Westwood: -4 (28 this year 24 last year)
- College View / South Platte: -5 (25 this year 20 last year)
- Fort Logan: -5 (74 this year 69 last year)
- Montbello: -5 (41 this year 36 last year)
- Rosedale: -5 (54 this year 49 last year)
- Virginia Village: -5 (68 this year 63 last year)
- Washington Park: -5 (75 this year 70 last year)
- Lowry Field: -6 (47 this year 41 last year)
- Northeast Park Hill: -6 (22 this year 16 last year)
- Elyria-Swansea: -7 (20 this year 13 last year)
- University Park: -7 (66 this year 59 last year)
- Athmar Park: -8 (31 this year 23 last year)
- Kennedy: -8 (36 this year 28 last year)
- Mar Lee: -8 (45 this year 37 last year)
- City Park: -10 (32 this year 22 last year)
- Platt Park: -13 (63 this year 50 last year)
- Skyland: -15 (42 this year 27 last year)
- Cory-Merrill: -17 (69 this year 52 last year)
- South Park Hill: -17 (62 this year 45 last year)
- Cherry Creek: -18 (76 this year 58 last year)
- Ruby Hill: -21 (53 this year 32 last year)
Denver crime news
- 20-year-old charged with vehicular homicide in Denver hit-and-run that killed Uber passenger
- Published September 21
- and filed under traffic accident, vehicular homicide, homicide
- in Cheesman Park
- Denver Police Blotter: Woman's ex-boyfriend allegedly sets her home on fire
- Published September 20
- and filed under arson, burglary
- in Cherry Creek, East Colfax, Westwood
- Computer crash leads to lock down at Denver jails
- Published September 20
- Denver police officers will get raise if City Council approves union contract
- Published September 19
- Colorado attorney general and counterparts widen probe into opioid manufacturers and distributors
- Published September 19
- and filed under drug and alcohol crime
- Someone stole a Denver Parks and Rec pick-up truck from City Park
- Published September 19
- and filed under motor vehicle theft
- in City Park, Jefferson Park
- annabist.co-2017-09-19-denver-420-miguel-lopez-ban-appeal-court
- Published September 19
- in Civic Center
- Denver area sees alarming increase in reported hit-and-run crashes in 2017
- Published September 18
- and filed under traffic accident, hit and run
Denver Crime Statistics Update
The Denver crime map's up to date, the Denver crime reports are current, and each of the Denver neighborhood crime reports have the latest news, stats, and incidents.
To unsubscribe, reply with UNSUBTHURSDAY in the email.
Good work getting to the bottom of this,
Joe
@denvercrimes
Denver crime news • Neighborhood crime reports • Denver crime rate • Denver crime map • Crime features • Crime type reports
About Denver Crimes • Site Updates • Site Map • Contact
Featured: Denver's 2025 crime map.
Denver crime maps
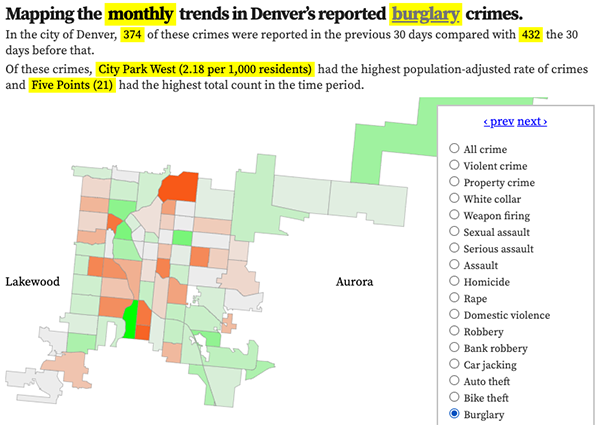
Denver crime trends map
The crimes trends map shows the change in crime counts and rates on a monthly and year-to-date basis.

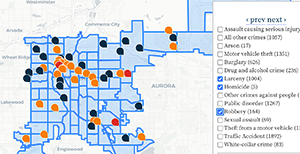
The Denver-city recent crime map
The recent crimes map shows where crimes across the city were reported in the last two or so months, and shows which addresses across the city have logged the most reported crimes.

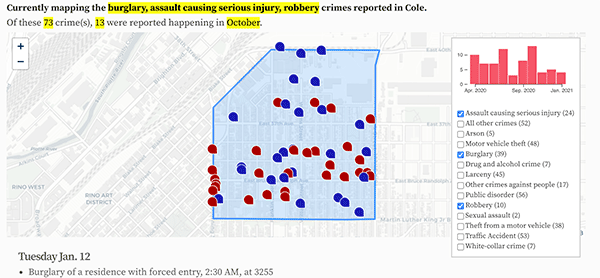
All city crime maps
Choose from neighborhood and crime-specific crime maps.
