So far this year, University ranks in reported crime rates:
Rankings range from 1st (worst) to 78th (best).
- 58th (out of Denver's 78 neighborhoods) in violent crimes per 1,000 residents (up from 61st last year. 1.06 violent crimes per 1,000 residents this year, 0.85 up until this point last year)
- 66th in population-adjusted property crimes (down from 53rd in 2023. 6.49 property crimes per 1,000 residents in 2024, 10.65 in 2023)
- 35th in population-adjusted sexual assaults (even ranking with in 2023. 0.21 sexual assaults per 1,000 residents in 2024, 0.21 in 2023)
- 58th in population-adjusted domestic violence crimes (down from 39th in 2023. 0.32 domestic violence crimes per 1,000 residents in 2024, 0.53 in 2023)
- 33rd in population-adjusted robberies (up from 41st in 2023. 0.43 robberies per 1,000 residents in 2024, 0.32 in 2023)
- 70th in population-adjusted burglaries (down from 54th in 2023. 0.64 burglaries per 1,000 residents in 2024, 1.38 in 2023)
- 62nd in population-adjusted car thefts (even ranking with in 2023. 2.02 car thefts per 1,000 residents in 2024, 2.45 in 2023)
- 21st in population-adjusted bike thefts (even ranking with in 2023. 0.43 bike thefts per 1,000 residents in 2024, 0.53 in 2023)
- 71st in population-adjusted drug crimes (down from 67th in 2023. 0.0 drug crimes per 1,000 residents in 2024, 0.11 in 2023)
Compare University crime rate rankings in recent years
The lower the rank, the worse University's crime rate. There are 78 Denver neighborhoods, so the rankings are out of 78.
A table comparing University violent crime rates
Shown here are the population-adjusted crime rates for University.
| Year | Violent crime | Domestic violence |
Sexual assault | Robbery | Aggravated assault |
|---|---|---|---|---|---|
| 2023 | 68th | 66 | 27 | 62 | 71 |
| 2022 | 65th | 59 | 49 | 48 | 72 |
| 2021 | 71st | 71 | 72 | 59 | 71 |
| 2020 | 75th | 77 | 65 | 67 | 74 |
| 2019 | 59th | 77 | 56 | 44 | 66 |
A table comparing University property crime rates
| Year | Property crime |
Auto theft | Bicycle theft | Arson |
|---|---|---|---|---|
| 2023 | 57th | 62 | 26 | 65 |
| 2022 | 57th | 62 | 29 | 47 |
| 2021 | 61st | 74 | 33 | 71 |
| 2020 | 66th | 74 | 26 | 66 |
| 2019 | 60th | 73 | 23 | 52 |
A table comparing University burglary crime rates
| Year | Residential burglary |
Business burglary |
Burglary, forced entry |
Burglary, unforced |
|---|---|---|---|---|
| 2023 | 56 | 57 | 65 | 50 |
| 2022 | 57 | 55 | 58 | 60 |
| 2021 | 35 | 72 | 67 | 31 |
| 2020 | 66 | 76 | 77 | 66 |
| 2019 | 65 | 74 | 78 | 60 |
More: Compare crime rate rankings across all 78 Denver neighborhoods.
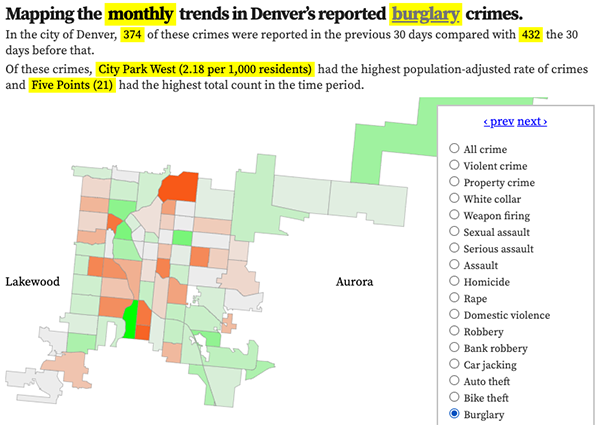
Featured: Denver's big-picture crime trends map.
Denver crime maps
Denver crime trends map
The crimes trends map shows the change in crime counts and rates on a monthly and yearly basis.

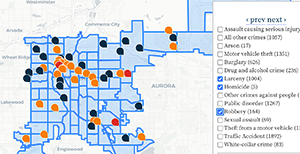
The Denver-city recent crime map
The recent crimes map shows where crimes across the city were reported in the last two or so months, and shows which addresses across the city have logged the most reported crimes.

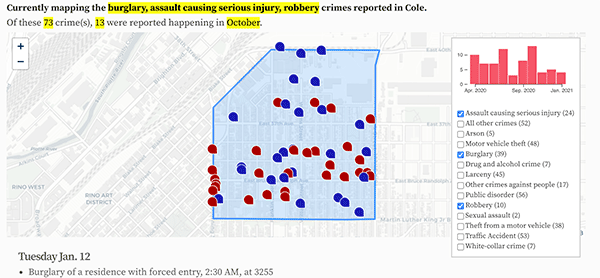
All city crime maps
Choose from neighborhood and crime-specific crime maps.
