Crime ranking changes from December to January
There were 10 ranking changes in major crime categories when comparing the rankings from December to January. The lower the rank the worse the reported crime rate is in Lincoln Park.
- Lincoln Park improved 2 ranks, from 7th to 9th.
- Lincoln Park fell 1 rank, from 3rd to 2nd.
- Lincoln Park improved 32 ranks, from 7th to 39th.
- Lincoln Park improved 37 ranks, from 3rd to 40th.
- Lincoln Park improved 9 ranks, from 6th to 15th.
- Lincoln Park improved 7 ranks, from 5th to 12th.
- Lincoln Park improved 35 ranks, from 4th to 39th.
- Lincoln Park improved 10 ranks, from 8th to 18th.
- Lincoln Park improved 41 ranks, from 6th to 47th.
- Lincoln Park improved 4 ranks, from 6th to 10th.
In serious assaults:
In burglaries:
In domestic violence crimes:
In homicides:
In property crimes:
In robberies:
In sexual assaults:
In Thefts:
In bicycle thefts:
In violent crimes:
See all the Lincoln Park crime rate ranking changes.
Lincoln Park crime counts for January, in comparison
Violent crimes in Lincoln Park
Violent crime in January was up in Denver from December of last year, and up compared against January 2024, and down compared with the 2025 average of 7 violent crimes per month.
Serious assaults in Lincoln Park
Serious assault in January was up in Denver from December of last year, and up compared against January 2024, and down compared with the 2025 average of 5 serious assaults per month.
Property crimes in Lincoln Park
Property crime in January was up in Denver from December of last year, and down compared against January 2024, and down compared with the 2025 average of 49 property crimes per month.
Burglaries in Lincoln Park
Burglary in January was up in Denver from December of last year, and up compared against January 2024, and up compared with the 2025 average of 9 burglaries per month.
Neighbors report, January 2025
How does the overall crime-rate ranking of Lincoln Park compare to its neighboring neighborhoods, Sun Valley, Civic Center, Auraria, Baker, Lincoln Park.
The higher the rank, the worse that neighborhood's adjusted-for-population crime rate. Rankings are based on cumulative crimes from January to January.
Violent Crime
- 1. Civic Center
- 5. Sun Valley
- 9. Auraria
- 10. Lincoln Park
- 19. Baker
Property Crime
- 2. Auraria
- 4. Civic Center
- 10. Lincoln Park
- 13. Sun Valley
- 16. Baker
Aggravated Assault
- 1. Civic Center
- 8. Sun Valley
- 10. Lincoln Park
- 11. Auraria
- 18. Baker
Sexual Assault
- 2. Lincoln Park
- 28. Baker
- 31. Civic Center
- 43. Sun Valley
- 60. Auraria
Domestic Violence
- 2. Lincoln Park
- 28. Baker
- 31. Civic Center
- 43. Sun Valley
- 60. Auraria
Robbery
- 1. Sun Valley
- 2. Civic Center
- 5. Auraria
- 13. Lincoln Park
- 16. Baker
Burglary
- 2. Civic Center
- 4. Lincoln Park
- 11. Baker
- 21. Sun Valley
- 34. Auraria
More: Compare crime rate rankings across all 78 Denver neighborhoods.
Featured: Each neighborhood now has a list of its high-crime addresses.
Denver crime maps
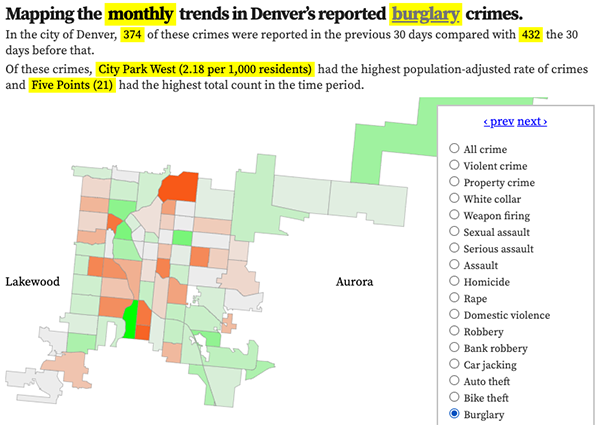
Denver crime trends map
The crimes trends map shows the change in crime counts and rates on a monthly and year-to-date basis.

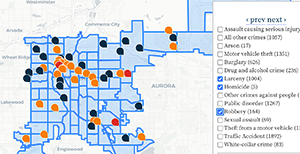
The Denver-city recent crime map
The recent crimes map shows where crimes across the city were reported in the last two or so months, and shows which addresses across the city have logged the most reported crimes.

All city crime maps
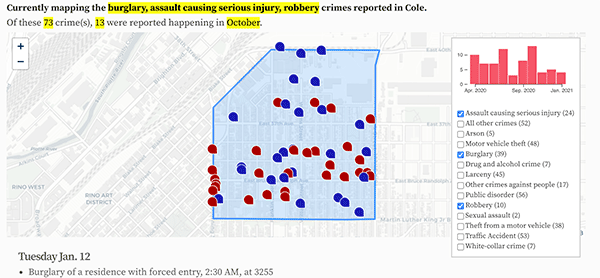
Choose from neighborhood and crime-specific crime maps.
