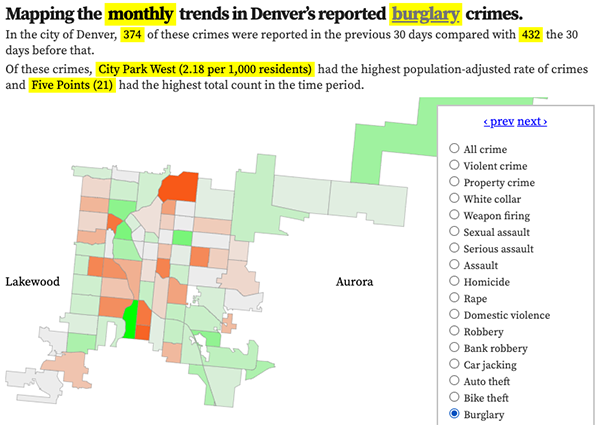
Denver neighborhood map, sexual assaults per 1,000 residents, 2025
Reported sexual assaults per 1,000 residents. Hover over or tap a neighborhood for details.
Denver sexual assault statistics
Monthly reported sexual assaults in Denver
In the last 48 months, the average number of crimes in a month was 0 and the median was 0.0. The most in any month was zero, in November 2025, and the least was zero in December 2021.
Sexual assault crimes, by time of day
What time reported sexual assaults happen in Denver.
Sexual assault crimes, by weekday
The day of the week reported sexual assaults happen.
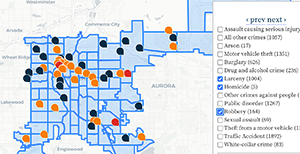
Featured: Denver's big-picture crime trends map.
Denver sexual assaults in the news
- Sexual assault, drugging trial begins for former owner of Grateful Dead-themed bars
- Published October 21
- Denver sheriff’s deputy arrested on allegations of off-duty sexual misconduct involving former inmate
- Published September 29
- Man charged in Denver sexual assault cold case gets 32 years in prison
- Published September 18
- Cleaning crew boss at Denver’s Ball Arena sexually abused women who worked for him, police allege
- Published September 2
Recent crime ranking changes in sexual assault
There were 6 notable ranking changes in these crime categories when comparing the rankings four weeks ago to the current rankings. This list updates Mondays. The lower the rank the worse the reported crime.
- Cole fell 14 ranks, from 36th to 22nd.
- Ruby Hill fell 19 ranks, from 53rd to 34th.
- Westwood fell 6 ranks, from 41st to 35th.
- Central Park fell 4 ranks, from 25th to 21st.
- Harvey Park South fell 8 ranks, from 57th to 49th.
- Jefferson Park fell 3 ranks, from 13th to 10th.
Featured: The best and worst neighborhoods for sexual assaults.


