Top-ten highest robbery rates, by neighborhood, 2024
- Civic Center: 4.52 per 1,000 residents (8 incidents total)
- CBD: 4.45 (18)
- Sun Valley: 3.48 (5)
- DIA: 3.25 (4)
- Lincoln Park: 1.99 (12)
- Union Station: 1.78 (9)
- Central Park: 1.7 (30)
- West Colfax: 1.54 (14)
- East Colfax: 1.33 (15)
- Five Points: 1.22 (18)
Top-ten highest robbery counts, by neighborhood, 2024
- Central Park: 30 incidents
- Five Points: 18
- CBD: 18
- East Colfax: 15
- West Colfax: 14
- Montbello: 13
- Lincoln Park: 12
- Gateway / Green Valley Ranch: 10
- Capitol Hill: 10
- Washington Virginia Vale: 9
New: The prostitution crime report.
The Denver neighborhoods with the lowest robbery numbers
These are the neighborhoods with the lowest total number of robberies and the lowest population-adjusted robbery rate in 2024
Best robbery crime rates, by neighborhood, 2024
- Whittier: 0.0 (0)
- City Park: 0.0 (0)
- Country Club: 0.0 (0)
- Washington Park: 0.0 (0)
- Skyland: 0.0 (0)
- Regis: 0.0 (0)
- Fort Logan: 0.0 (0)
- Overland: 0.0 (0)
- Hilltop: 0.0 (0)
- Auraria: 0.0 (0)
Lowest robbery counts, by neighborhood, 2024
- Whittier: 0
- City Park: 0
- Country Club: 0
- Washington Park: 0
- Skyland: 0
- Regis: 0
- Fort Logan: 0
- Overland: 0
- Hilltop: 0
- Auraria: 0
- Rosedale: 0
- Platt Park: 0
- North Park Hill: 0
- Jefferson Park: 0
- Harvey Park South: 0
- Indian Creek: 0
New: Colorado state crime rate charts.
Denver crime maps
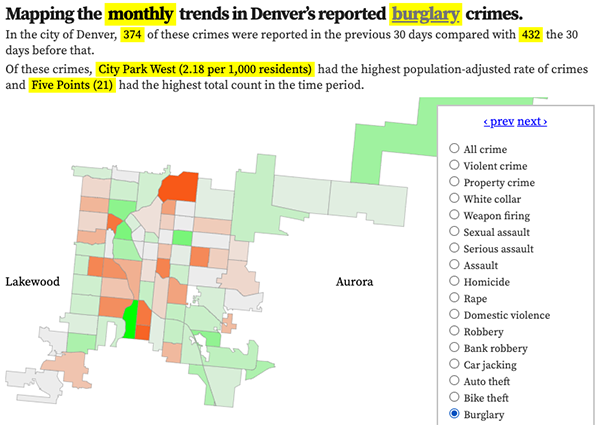
Denver crime trends map
The crimes trends map shows the change in crime counts and rates on a monthly and yearly basis.

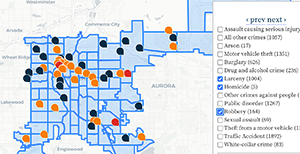
The Denver-city recent crime map
The recent crimes map shows where crimes across the city were reported in the last two or so months, and shows which addresses across the city have logged the most reported crimes.

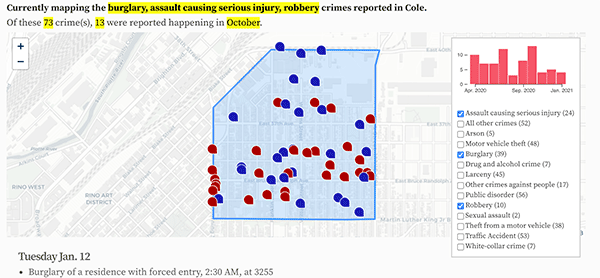
All city crime maps
Choose from neighborhood and crime-specific crime maps.
