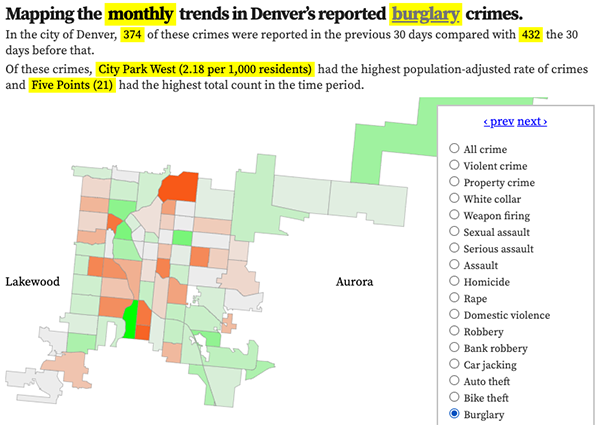
Denver neighborhood map, domestic violence crimes per 1,000 residents, 2025
Reported domestic violence crimes per 1,000 residents. Hover over or tap a neighborhood for details.
Denver domestic violence statistics
Monthly reported domestic violence crimes in Denver
In the last 48 months, the average number of crimes in a month was 0 and the median was 0.0. The most in any month was zero, in November 2025, and the least was zero in December 2021.
Domestic violence crimes, by time of day
What time reported domestic violence crimes happen in Denver.
Domestic violence crimes, by weekday
The day of the week reported domestic violence crimes happen.
Featured: Read the October 2025 Denver-city crime report.
Denver domestic violence crimes in the news
- Record-high 8 children killed in Colorado domestic violence incidents last year is ‘a wake-up call’
- Published October 21
- Denver police fatally shoot man in southeast Denver while responding to domestic violence call
- Published August 22
- Denver jury finds man guilty of murder in domestic violence shooting
- Published July 2
- Denver DA develops two new units in response to 12% increase in domestic violence cases last year
- Published June 19
Recent crime ranking changes in domestic violence
There were 1 notable ranking changes in these crime categories when comparing the rankings four weeks ago to the current rankings. This list updates Mondays. The lower the rank the worse the reported crime.
- Baker fell 5 ranks, from 33rd to 28th.
Featured: The best and worst neighborhoods for domestic violence crimes.


