The addresses in the City of Denver with the most reported crime
These are the City of Denver addresses that have had the most crime reports this year.
| Rank | Address | Crime count | Neighborhood |
|---|---|---|---|
| 0. | 490 W Colfax Ave | 442 | Civic Center |
| 1. | 8400 Pena Blvd | 342 | DIA |
| 2. | 8500 Pena Blvd | 284 | DIA |
| 3. | 1331 N Cherokee St | 226 | Civic Center |
| 4. | 7800 E Smith Rd | 221 | Central Park |
| 5. | 2730 S Colorado Blvd | 213 | University Hills |
| 6. | 1505 S Colorado Blvd | 170 | Cory-Merrill |
| 7. | 3000 E 1st Ave | 157 | Cherry Creek |
| 8. | 1600 California St | 152 | CBD |
| 9. | 7930 E Northfield Blvd | 142 | Central Park |
| 10. | 777 N Bannock St | 127 | Lincoln Park |
| 11. | 7311 E 29th Dr | 109 | Central Park |
| 12. | 7757 E 36th Ave | 109 | Central Park |
| 13. | 8560 E Northfield Blvd | 108 | Central Park |
| 14. | 2770 W Evans Ave | 105 | College View / South Platte |
| 15. | 8148 Pena Blvd | 100 | DIA |
| 16. | 2780 S Colorado Blvd | 86 | University Hills |
| 17. | 3870 N Quebec St | 85 | Central Park |
| 18. | 1416 Platte St | 83 | Highland |
| 19. | 1701 Wynkoop St | 79 | Union Station |
| 20. | 6200 E Colfax Ave | 77 | Montclair |
See the full list of City of Denver addresses with the most reported crimes
Featured: The 16th Street Mall crime report.
Denver crime maps
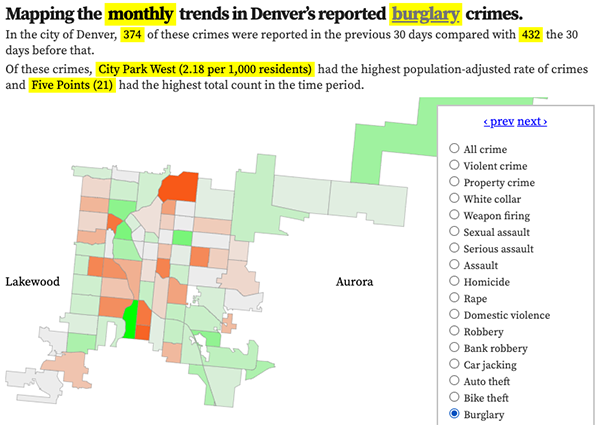
Denver crime trends map
The crimes trends map shows the change in crime counts and rates on a monthly and year-to-date basis.

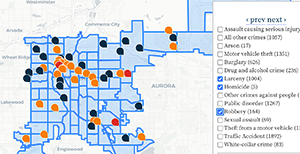
The Denver-city recent crime map
The recent crimes map shows where crimes across the city were reported in the last two or so months, and shows which addresses across the city have logged the most reported crimes.

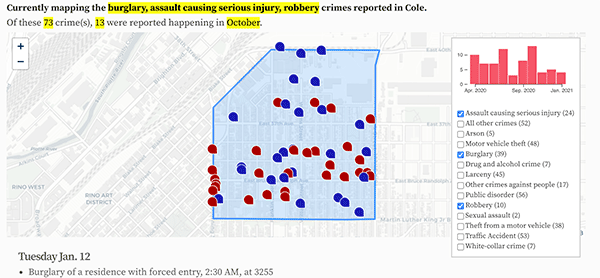
All city crime maps
Choose from neighborhood and crime-specific crime maps.
