Residential burglaries in Denver are down to about 5 a day, down from 6 a day in 2023, while the neighborhoods worst-off have had some turnover.
Published Monday Oct 14, 2024
Residential burglaries in Denver are down to about 5 a day, down from 6 a day in 2023, while the neighborhoods worst-off have had some turnover.
In the city of Denver, residential burglaries so far in 2024 are slightly down from 2023’s figures. Through the end of September, Denver is averaging 163 residential burglarys a month — in 2023, the city averaged 188 a month. These monthly numbers are nowhere near what they were in 2021, when more than 3,000 residential burglaries were reported (about 250 / month), and May of that year saw 301 crimes in the month, nearly an average of 10 per day.
And if we want to go back to the 2010s, residential burglaries used to be much worse. From 2014 to 2016, more than 3,000 were reported a year, peaking at about 3,400 in 2015, an average of more than 280 per month.
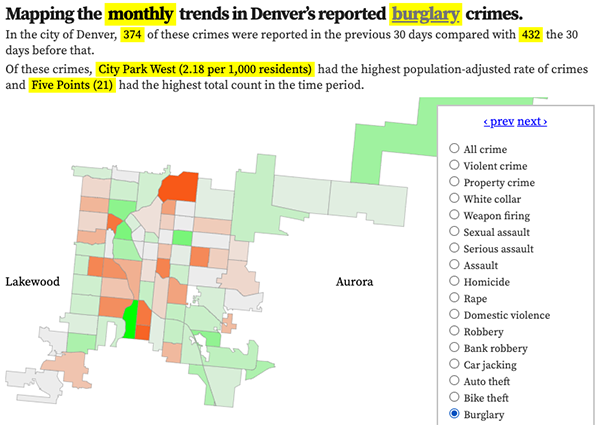
On a neighborhood by neighborhood basis, the neighborhoods with the highest residential burglary rates in 2024 are not the same as in 2023. DIA and Civic Center top the rankings both years, but beyond that nothing is the same.
Highest residential burglary rates in Denver, 2023 vs. 2024
Data shown covers January to the end of September.
2024 residential burglary rates
- DIA
- Civic Center
- West Colfax
- Jefferson Park
- Lincoln Park
2023
- DIA
- Civic Center
- Washington Park West
- City Park West
- Five Points
Highest residential burglary counts in Denver, 2023 vs. 2024
Data shown covers January to the end of September.
2024 residential burglary counts
- Five Points, 80 residential burglaries reported
- Central Park, 64
- Capitol Hill, 59
- West Colfax, 56
- East Colfax, 51
2023
- Five Points, 88 residential burglaries reported
- Capitol Hill, 67
- Central Park, 63
- East Colfax, 53
- Montbello, 47


