New: The West High School crime report.
The past 30 days in Lincoln Park crime
- There were 5 reported incidents of violent crime in the past 30 days. That's more than the 4 30 days before that and less than the monthly average in the last 12 months of 6.2 per month in Lincoln Park.
- Domestic violence: No incidents the past 30 days, 0 the 30 days before that. The 12-month monthly average is 0.0.
- Sex assault: No incidents the past 30 days, 0 the 30 days before that. The 12-month monthly average is 0.0.
- Robbery: No incidents the past 30 days, 1 the 30 days before that. The 12-month monthly average is 1.4.
- Burglary: 9 incidents the past 30 days, 11 the 30 days before that. The 12-month monthly average is 8.0.
- Property crimes: 49 incidents the past 30 days, 61 the 30 days before that. The 12-month monthly average is 43.8.
- Car thefts: 9 incidents the past 30 days, 11 the 30 days before that. The 12-month monthly average is 9.2.
- Bike thefts: 2 incidents the past 30 days, 1 the 30 days before that. The 12-month monthly average is 1.8.
Compare Lincoln Park to its neighbors
See how Lincoln Park's reported crime rate compares with the neighborhoods it borders (Sun Valley, Auraria, Baker, Civic Center).
Lincoln Park addresses with the most reported crime
These are the top Lincoln Park addresses in Denver that have had the most crime reports this year.
- 777 N Bannock St: 127
- 1300 W Colfax Ave: 53
- 741 N Osage St: 33
- 1400 Block N Osage St: 28
- 725 N Kalamath St: 25
The full list of Lincoln Park addresses with the most reported crimes
Latest notable crimes in Lincoln Park
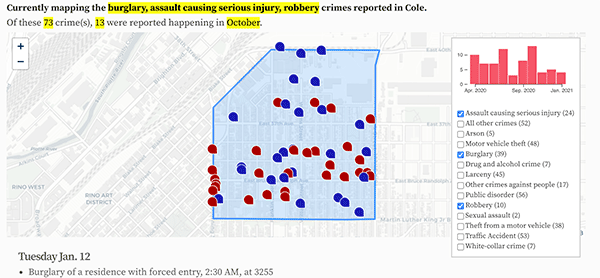
A Lincoln Park crime map and recent crime listing for homicides, serious assaults, burglaries and robberies.
Lincoln Park crime map
Reported assaults, by time of day
What time do most reported assaults in Lincoln Park happen?
Reported burglaries, by time of day
What time do most reported burglaries in Lincoln Park happen?
Reported robberies, by time of day
What time do most reported robberies in Lincoln Park happen?
Reported sexual assaults, by time of day
What time do most reported sexual assaults in Lincoln Park happen?
Latest homicides in Lincoln Park
- Wednesday July 30, 3:02 AM, at the 1000 block of W Colfax Ave.
Latest serious assaults in Lincoln Park
- Serious assault, Monday Nov. 10, 7:13 PM, at W 11th Ave and N Lipan St.
- Serious assault, Saturday Nov. 8, 5:39 PM, at 839 N Santa Fe Dr.
- Serious assault, Saturday Nov. 8, 7:00 AM, at the 700 block of N Inca St.
- Threatening to imminently injure with a weapon, Wednesday Oct. 29, 4:03 AM, at the 600 block of W 9th Ave.
- Serious assault, Saturday Oct. 18, 4:40 AM, at 1255 N Galapago St.
- Serious assault, Monday Oct. 6, 5:36 AM, at 777 N Bannock St.
- Threatening to imminently injure with a weapon, Friday Sept. 19, 10:32 PM, at N Santa Fe Dr and W 10th Ave.
- Assault causing serious injury in which a gun was fired, Saturday Sept. 13, 2:30 AM, at 777 N Bannock St.
- Serious assault, Monday Sept. 8, 8:47 AM, at W 10th Ave and N Kalamath St.
- Threatening to imminently injure with a weapon, Saturday Sept. 6, 4:04 AM, at the 600 block of N Broadway St.
Latest robberies in Lincoln Park
- Robbery of a person in the open, Friday Oct. 10, 3:30 AM, at W 10th Ave and N Osage St.
- Armed carjacking, Sunday Sept. 7, 10:46 PM, at 810 N Vallejo St.
- Robbery of a business using a weapon, Tuesday Sept. 2, 11:15 PM, at 987 N Santa Fe Dr.
- Armed carjacking, Saturday August 30, 4:15 AM, at the 1300 block of N Lipan St.
- Robbery of a person in the open, Thursday August 21, 6:00 AM, at 1225 N Santa Fe Dr.
- Robbery of a person in the open, Saturday August 16, 8:35 PM, at 901 W 14th Ave.
- Forcible purse snatching, Tuesday August 12, 8:26 AM, at W 11th Ave and N Osage St.
- Robbery of a person in the open, Friday July 11, 6:00 AM, at the 1400 block of N Mariposa St.
- Robbery of a person in the open, Friday July 4, 4:00 AM, at W 13th Ave and N Speer Blvd.
- Robbery of a business using a weapon, Wednesday June 25, 5:00 PM, at 1300 W Colfax Ave.
Latest burglaries in Lincoln Park
- Burglary of a business without forced entry, Tuesday Nov. 11, 12:00 AM, at 741 N Osage St.
- Burglary of a residence without forced entry, Monday Nov. 10, 5:25 PM, at 727 N Kalamath St.
- Burglary of a business with forced entry, Sunday Nov. 9, 4:00 AM, at 741 N Osage St.
- Burglary of a business with forced entry, Saturday Nov. 1, 11:00 PM, at 741 N Osage St.
- Burglary - other, Sunday Oct. 26, 10:00 AM, at the 900 block of N Inca St.
- Burglary of a residence without forced entry, Thursday Oct. 23, 8:30 PM, at the 1000 block of N Mariposa St.
- Burglary of a residence without forced entry, Sunday Oct. 19, 12:59 AM, at 935 N Lipan St.
- Burglary of a residence without forced entry, Saturday Oct. 18, 1:00 AM, at 1010 N Santa Fe Dr.
- Burglary of a residence without forced entry, Saturday Oct. 18, 12:00 AM, at 1011 N Inca St.
- Burglary of a business with forced entry, Saturday Oct. 11, 2:00 AM, at 1935 W 12th Ave.
New: Property crime per neighborhood compared, 2024 vs. 2023.
Crime in Lincoln Park, by day of the week
Lincoln Park property crimes, by day
The day of the week reported property crimes in Lincoln Park happen.
Lincoln Park violent crimes, by day
The day of the week reported violent crimes in Lincoln Park happen.
Monthly crimes in Lincoln Park
Monthly violent crime in Lincoln Park
In the last 48 months, the average number of crimes in a month was 8.5 and the median was 8.0. The most in any month was 19, in August 2024, and the least was three in November 2025.
Monthly property crime in Lincoln Park
In the last 48 months, the average number of crimes in a month was 63.9 and the median was 63.0. The most in any month was 91, in September 2024, and the least was 16 in November 2025.
So far this year, Lincoln Park ranks in reported crime rates:
Rankings range from 1st (worst) to 78th (best).
- 10th (out of Denver's 78 neighborhoods) in violent crimes per 1,000 residents (down from 6th last year. 11.92 violent crimes per 1,000 residents this year, 26.66 up until this point last year)
- 10th in population-adjusted property crimes (down from 6th in 2024. 85.62 property crimes per 1,000 residents in 2025, 118.09 in 2024)
- 2nd in population-adjusted sexual assaults (up from 4th in 2024. 0.0 sexual assaults per 1,000 residents in 2025, 5.13 in 2024)
- 2nd in population-adjusted domestic violence crimes (up from 10th in 2024. 0.0 domestic violence crimes per 1,000 residents in 2025, 6.13 in 2024)
- 13th in population-adjusted robberies (down from 5th in 2024. 2.82 robberies per 1,000 residents in 2025, 6.62 in 2024)
- 4th in population-adjusted burglaries (down from 3rd in 2024. 15.4 burglaries per 1,000 residents in 2025, 21.03 in 2024)
- 7th in population-adjusted car thefts (down from 2nd in 2024. 18.22 car thefts per 1,000 residents in 2025, 33.29 in 2024)
- 18th in population-adjusted bike thefts (down from 6th in 2024. 3.64 bike thefts per 1,000 residents in 2025, 8.45 in 2024)
- 12th in population-adjusted drug crimes (down from 8th in 2024. 14.08 drug crimes per 1,000 residents in 2025, 19.87 in 2024)
Compare Lincoln Park crime rate rankings in recent years
The lower the rank, the worse Lincoln Park's crime rate. There are 78 Denver neighborhoods, so the rankings are out of 78.
A table comparing Lincoln Park violent crime rates
Shown here are the population-adjusted crime rates for Lincoln Park.
| Year | Violent crime | Domestic violence |
Sexual assault | Robbery | Aggravated assault |
|---|---|---|---|---|---|
| 2023 | 10th | 14 | 8 | 11 | 11 |
| 2022 | 9th | 8 | 7 | 9 | 9 |
A table comparing Lincoln Park property crime rates
| Year | Property crime |
Auto theft | Bicycle theft | Arson |
|---|---|---|---|---|
| 2023 | 9th | 5 | 11 | 12 |
| 2022 | 10th | 8 | 20 | 7 |
A table comparing Lincoln Park burglary crime rates
| Year | Residential burglary |
Business burglary |
Burglary, forced entry |
Burglary, unforced |
|---|---|---|---|---|
| 2023 | 17 | 4 | 5 | 7 |
| 2022 | 17 | 9 | 8 | 12 |
See the full year-by-year rankings for Lincoln Park.
More: Compare crime rate rankings across all 78 Denver neighborhoods.
New: Sign up for weekly or monthly email updates (when there's new crime data).
Denver crime maps
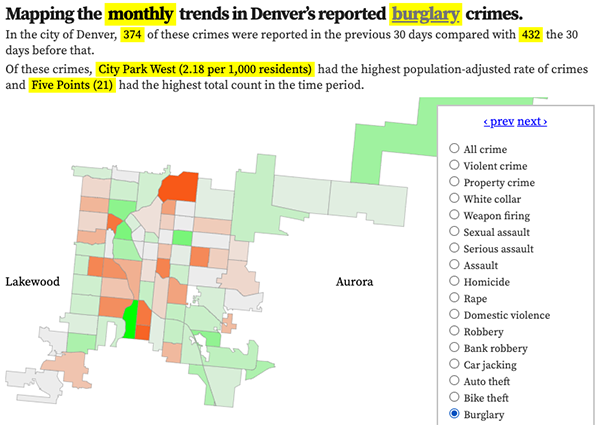
Denver crime trends map
The crimes trends map shows the change in crime counts and rates on a monthly and year-to-date basis.

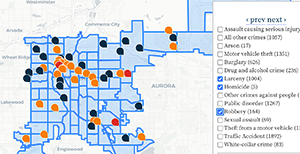
The Denver-city recent crime map
The recent crimes map shows where crimes across the city were reported in the last two or so months, and shows which addresses across the city have logged the most reported crimes.

All city crime maps
Choose from neighborhood and crime-specific crime maps.
