Featured: Read the October 2025 City Park West crime report
City Park West neighborhood ranking details
The ranking and crime rate for City Park West and each of the 5 neighborhoods it shares a border with.
Domestic Violence, 2025
- City Park: 0.0 reported incidents per 1,000 residents
- Whittier: 0.0
- Cheesman Park: 0.0
- North Capitol Hill: 0.0
- City Park West: 0.0
- Five Points: 0.0
Rape
- City Park: 0.0
- Whittier: 0.0
- Cheesman Park: 0.0
- North Capitol Hill: 0.0
- City Park West: 0.0
- Five Points: 0.0
Robberies
- Five Points: 4.47
- North Capitol Hill: 4.22
- City Park West: 3.93
- City Park: 1.56
- Cheesman Park: 0.7
- Whittier: 0.5
Violent Crime, 2025
- Five Points: 17.4 reported incidents per 1,000 residents
- North Capitol Hill: 15.87
- City Park West: 15.71
- City Park: 5.32
- Cheesman Park: 3.63
- Whittier: 3.17
Property Crime
- Five Points: 104.08
- North Capitol Hill: 81.72
- City Park West: 71.13
- City Park: 60.72
- Cheesman Park: 43.77
- Whittier: 21.87
Assaults
- Five Points: 28.24
- City Park West: 26.4
- North Capitol Hill: 26.0
- City Park: 9.39
- Cheesman Park: 5.97
- Whittier: 5.34
Compare all Denver neighborhood crime rates
Updated: Colorado state crime rate charts.
Denver crime maps
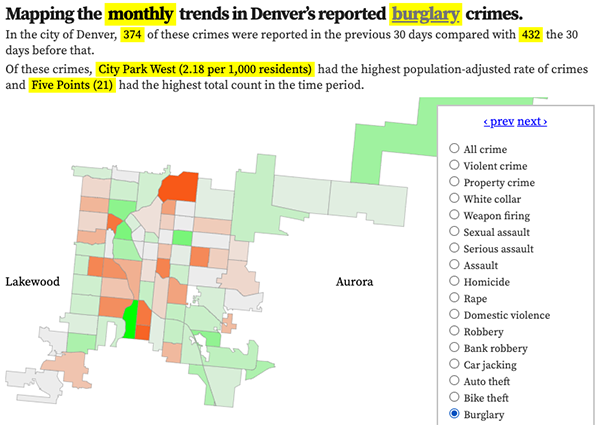
Denver crime trends map
The crimes trends map shows the change in crime counts and rates on a monthly and year-to-date basis.

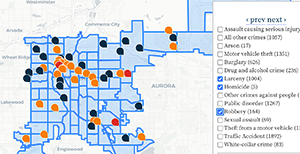
The Denver-city recent crime map
The recent crimes map shows where crimes across the city were reported in the last two or so months, and shows which addresses across the city have logged the most reported crimes.

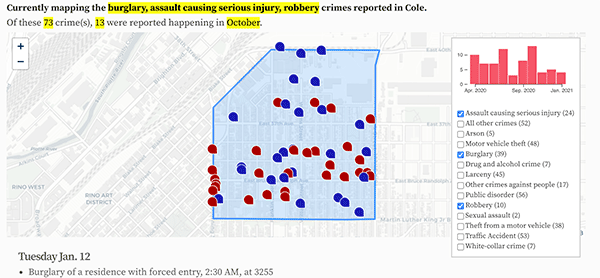
All city crime maps
Choose from neighborhood and crime-specific crime maps.
