Mapping the monthly trends in Denver’s reported crimes.
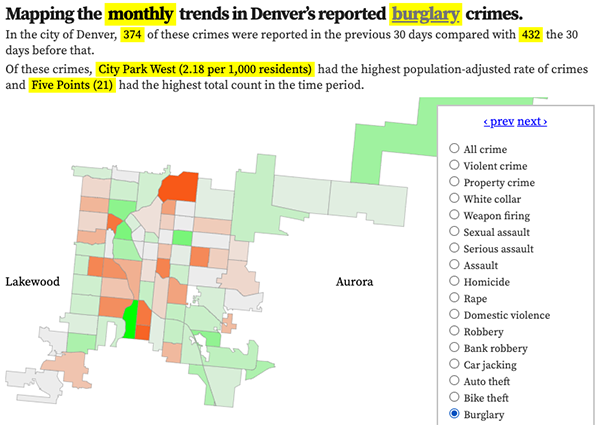
In the city of Denver, of these crimes were reported compared with the .
Of these crimes, had the highest population-adjusted rate of crimes and had the highest total count in the time period.
Now showing crimes reported happening in .
Denver crime map controls
Change in crimes per 1,000:
0
Updated: Colorado state crime rate charts.
Denver crime maps
Denver crime trends map
The crimes trends map shows the change in crime counts and rates on a monthly and year-to-date basis.

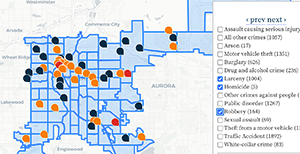
The Denver-city recent crime map
The recent crimes map shows where crimes across the city were reported in the last two or so months, and shows which addresses across the city have logged the most reported crimes.

All city crime maps
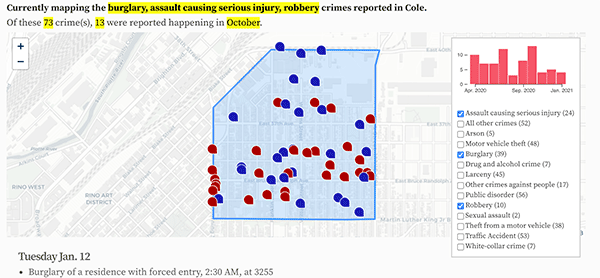
Choose from neighborhood and crime-specific crime maps.
