The Denver hit and run crime report for the year 2024.
Denver counted 0 hit and runs reported in 2024, an average of 0.0 per month / 0.0 per day.
In 2023, Denver averaged 0.0 per month, and the year before that (2022) Denver averaged 0.0 per month.
The average number of hit and runs per neighborhood in 2024 was 0.0.
Denver neighborhood map of reported hit and runs, 2024
Hit and runs, 2024
Individual hit and run crimes are indexed on the pages below:
- December 2024 hit and runs
- November 2024 hit and runs
- October 2024 hit and runs
- September 2024 hit and runs
- August 2024 hit and runs,
- July 2024 hit and runs
- June 2024 hit and runs
- May 2024 hit and runs
- April 2024 hit and runs
- March 2024 hit and runs
- February 2024 hit and runs
- January 2024 hit and runs
Hit and runs 2024, by neighborhood
New: Which neighborhoods saw the largest change in violent crime rates in 2024.
Denver crime maps
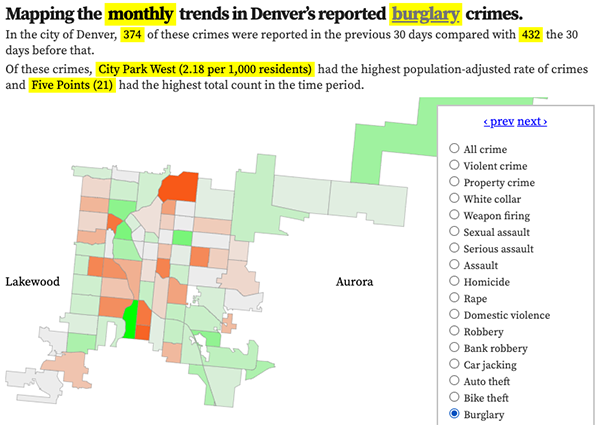
Denver crime trends map
The crimes trends map shows the change in crime counts and rates on a monthly and year-to-date basis.

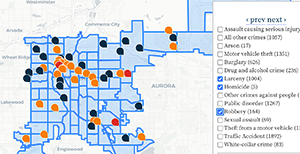
The Denver-city recent crime map
The recent crimes map shows where crimes across the city were reported in the last two or so months, and shows which addresses across the city have logged the most reported crimes.

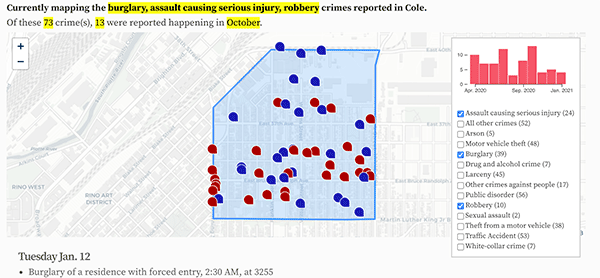
All city crime maps
Choose from neighborhood and crime-specific crime maps.
