Indecent Exposure: April 2025
The 18 indecent exposure crimes reported in April 2025.
- Indecent exposure, , at the 1300 block of Champa St in CBD.
- Indecent exposure, , at the 1200 block of S Federal Blvd in Ruby Hill.
- Indecent exposure, , at 2137 Larimer St in Five Points.
- Indecent exposure, , at 3901 S Ivy Way in Southmoor Park.
- Indecent exposure, , at 3030 S Syracuse Way in Hampden.
- Indecent exposure, , at E 36th Ave and N Central Park Blvd in Central Park.
- Indecent exposure, , at 490 W Colfax Ave in Civic Center.
- Indecent exposure, , at N Broadway St and E 14th Ave in Civic Center.
- Indecent exposure, , at N Federal Blvd and W Regis Blvd in Regis.
- Indecent exposure, , at the 600 block of E 20th Ave in North Capitol Hill.
- Indecent exposure, , at 490 W Colfax Ave in Civic Center.
- Indecent exposure, , at the 1900 block of N Washington St in North Capitol Hill.
- Indecent exposure, , at the 1300 block of N Gaylord St in Cheesman Park.
- Indecent exposure, , at 490 W Colfax Ave in Civic Center.
- Indecent exposure, , at 2941 N Williams St in Whittier.
- Indecent exposure, , at the 1600 block of Market St in Union Station.
- Indecent exposure, , at E Colfax Ave and N Trenton St in East Colfax.
- Indecent exposure, , at 144 W Colfax Ave in Civic Center.
Tuesday April 1
Thursday April 3
Sunday April 6
Thursday April 10
Friday April 11
Wednesday April 16
Sunday April 20
Monday April 21
Thursday April 24
Monday April 28
Wednesday April 30
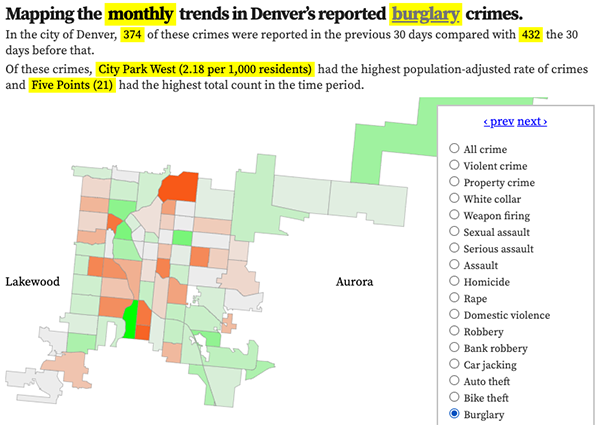
Featured: Denver's big-picture crime trends map.
Denver crime maps
Denver crime trends map
The crimes trends map shows the change in crime counts and rates on a monthly and year-to-date basis.

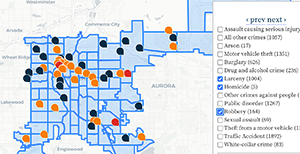
The Denver-city recent crime map
The recent crimes map shows where crimes across the city were reported in the last two or so months, and shows which addresses across the city have logged the most reported crimes.

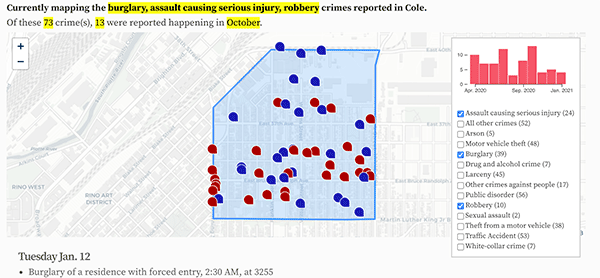
All city crime maps
Choose from neighborhood and crime-specific crime maps.
